Using the Management UI
This guide introduces the Management UI of EventSourcingDB. The UI provides a convenient way to monitor the system state and query events without writing code.
Overview
The Management UI consists of two main views:
- A Dashboard that displays the current system health, including event counts, license usage, available disk space, memory usage, and other operational metrics.
- An EventQL Query Editor that allows you to write and execute EventQL queries with a familiar developer experience, including syntax highlighting, auto-completion, error checking, and real-time feedback.
Accessing the Management UI
The Management UI is available only when EventSourcingDB is started with the --with-ui CLI flag. Authentication is required to access the UI: simply provide the API token configured for the database.
Security Notice
The Management UI is intended only for development and debugging purposes. It should never be exposed to the public internet.
Dashboard View
The dashboard provides a visual overview of the database status. It aggregates information available from the health endpoint and presents it in an easy-to-read format.
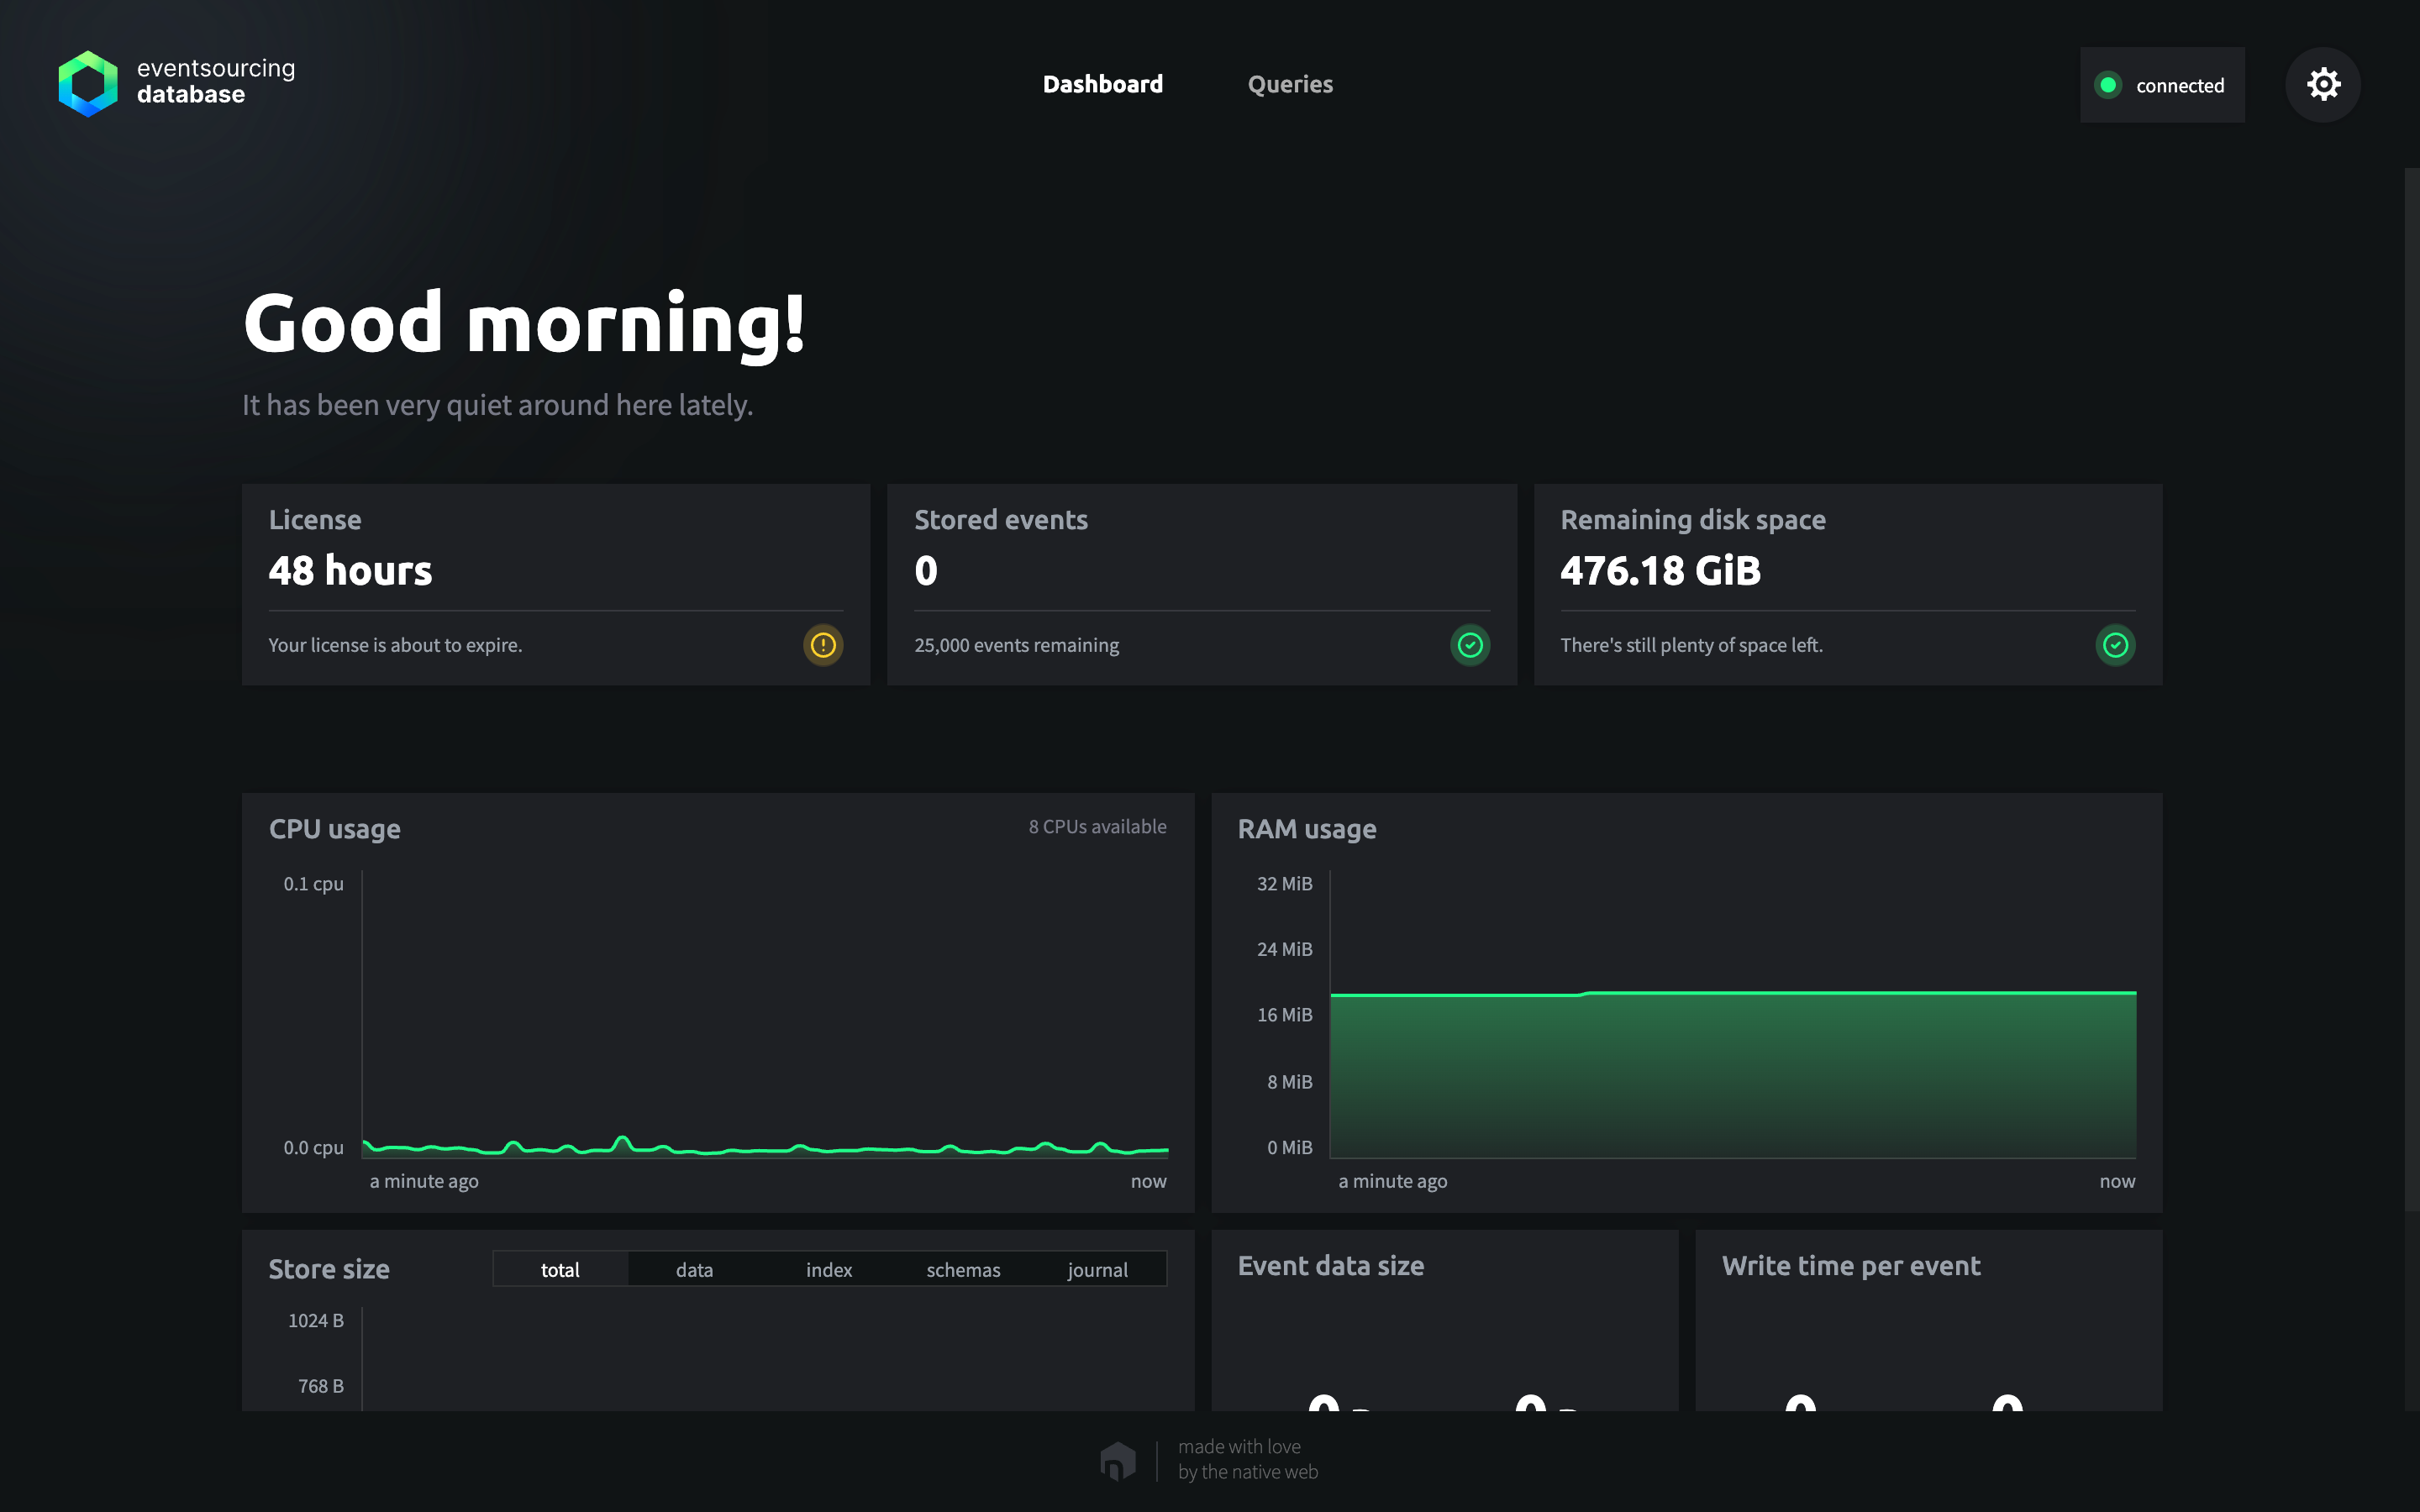
For additional details, see Logging and Monitoring.
EventQL View
The EventQL editor enables you to write and execute queries directly against the event store.
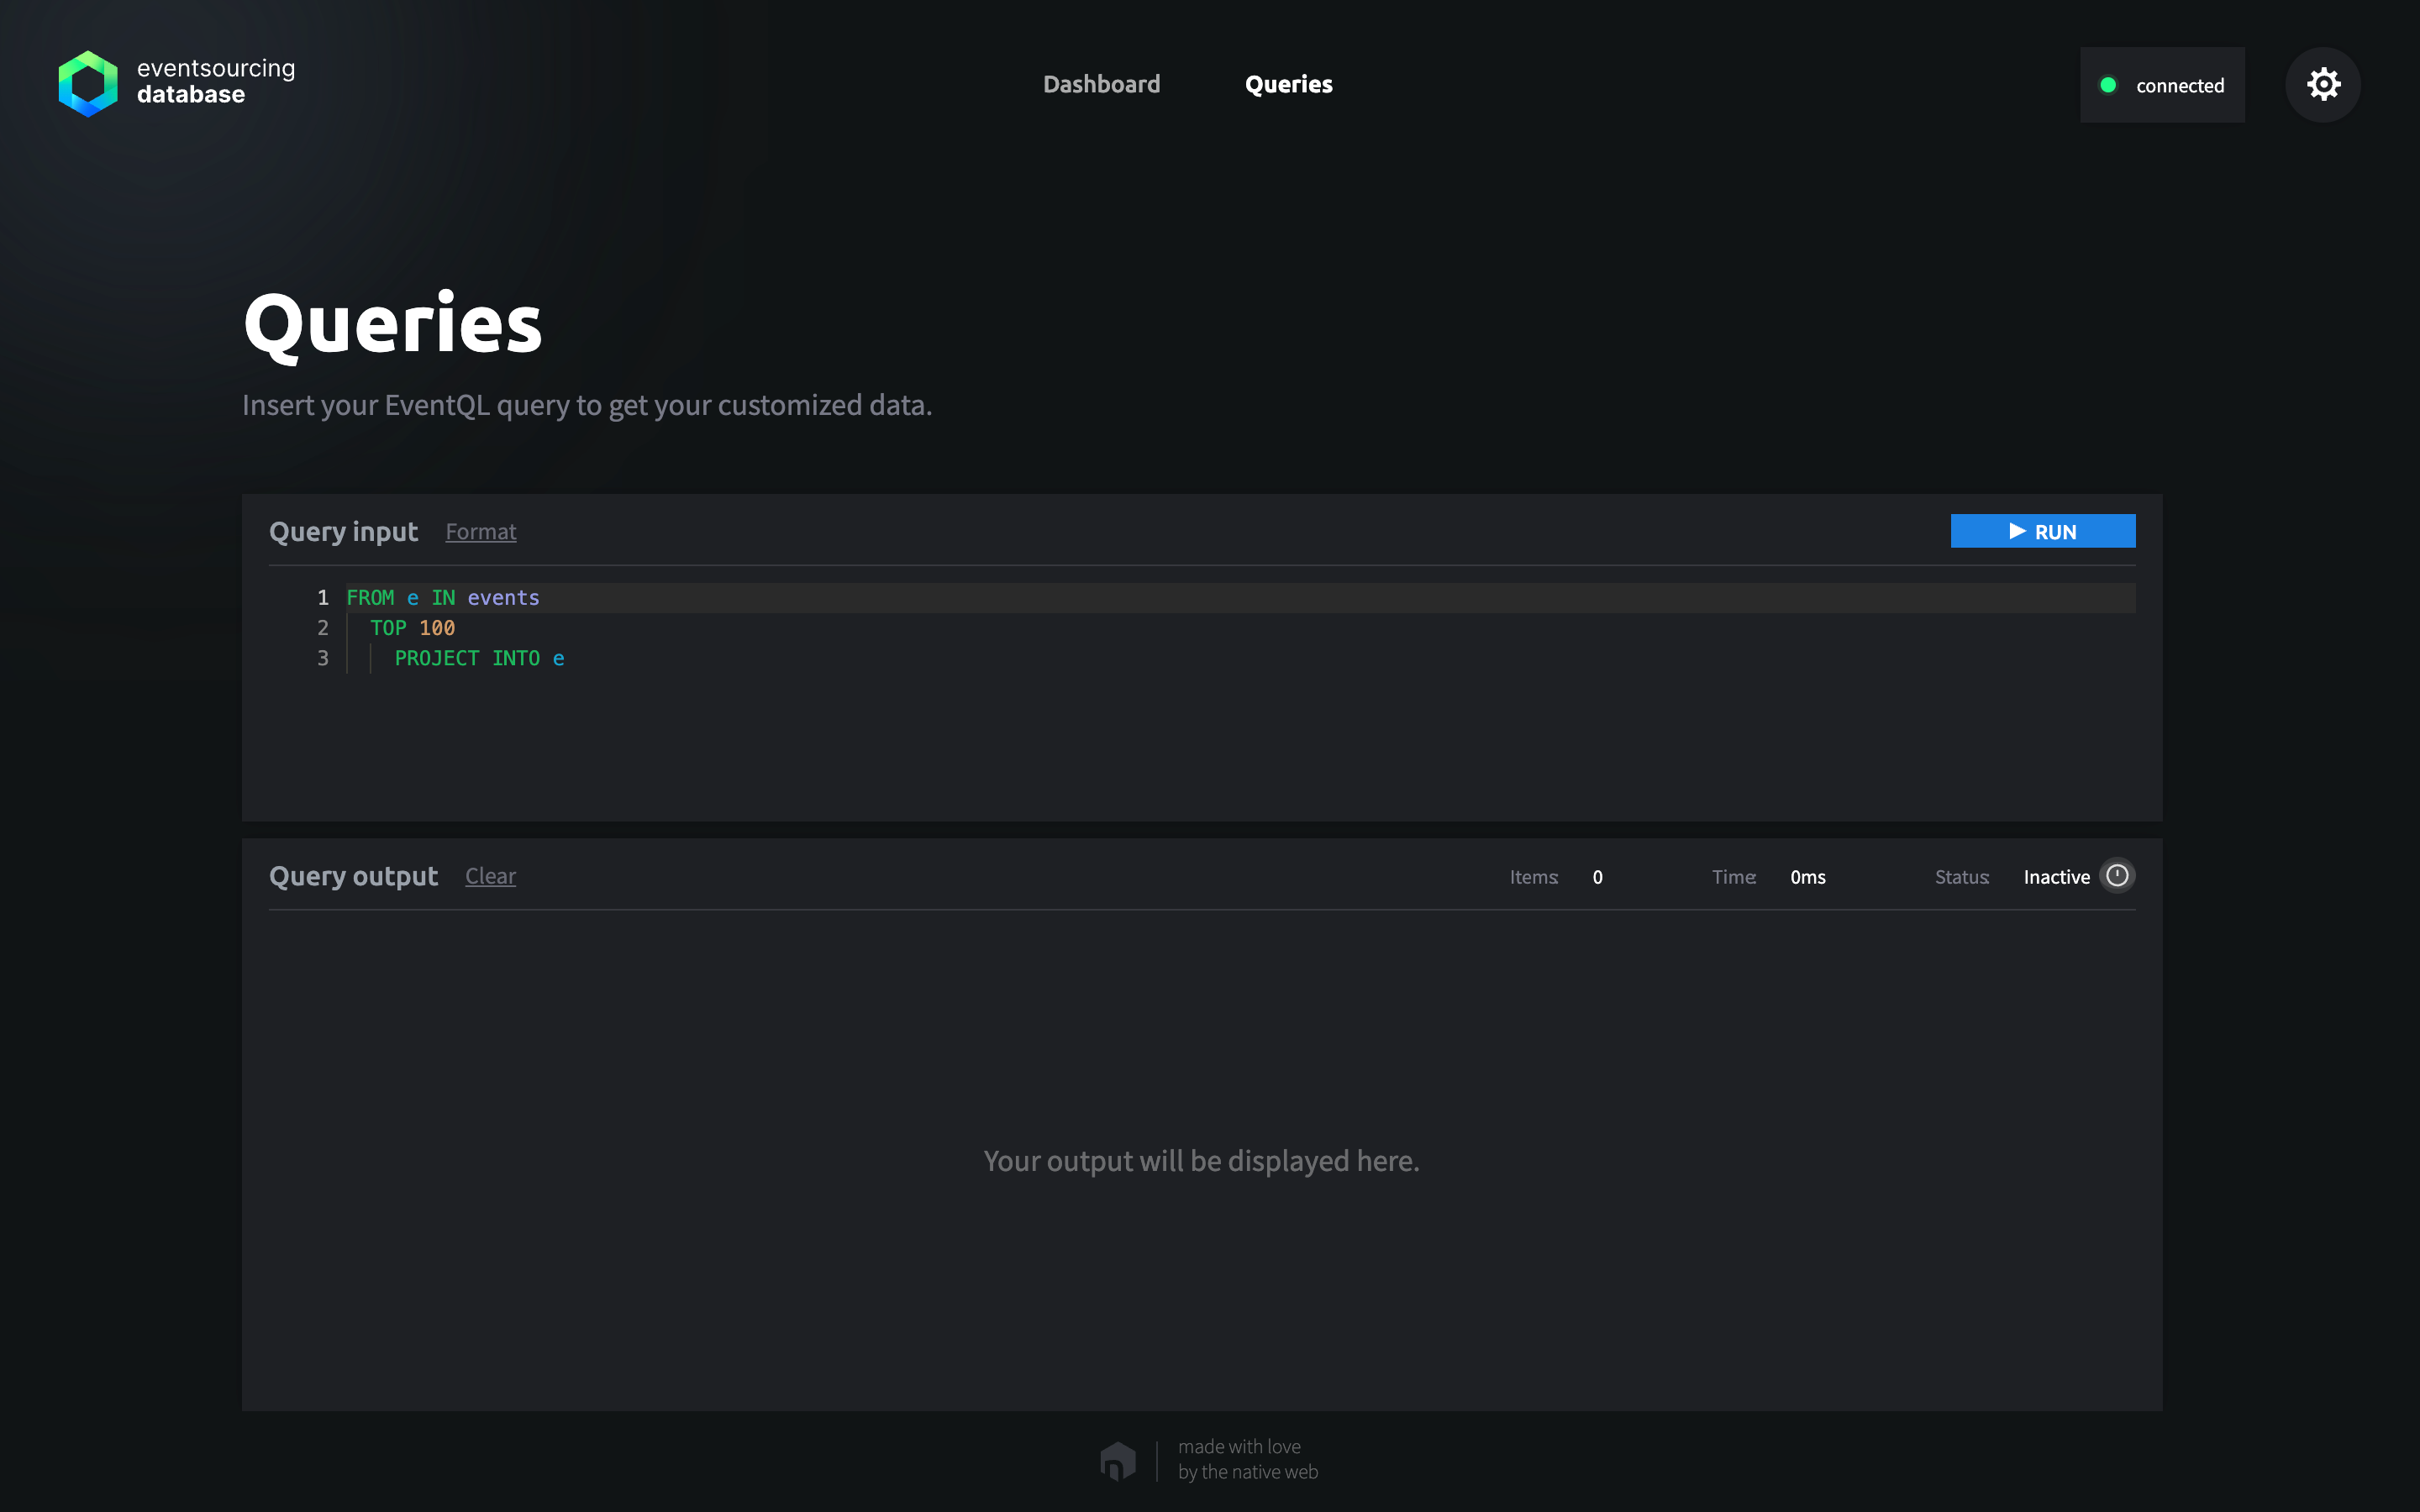
For more information, see Running EventQL Queries.