Someone Built a Visualizer for ESDM – And It Wasn't Us
In mid-July, we put ESDM under the MIT license and wrote down a sentence that we meant as a principle: because the schema is public, tooling built on ESDM never needs us in the loop. Two weeks later, that sentence turned out to be a prediction instead.
Impierce Technologies, a company in the Netherlands and good friends of ours, built the ESDM Visualizer: an open source web application that turns a folder full of .esdm.yaml files into a board you can walk through, click into, and share as a link. Nobody asked us, and nobody had to. Here is what it is, what it does, and how to have it running against your own model in about a minute.
From Files to a Board
ESDM, which we introduced in May, describes an event-sourced domain – Aggregates, Events, Commands, Queries, Read Models, Actors, Bounded Contexts – as plain YAML files that sit next to your code. That is the entire point of the format: a model you can diff, review in a pull request, and validate in CI, because it is text and not a picture.
The catch is that text has one weakness a whiteboard doesn't have. Reading twenty-five files tells you what is in the model, but it doesn't show you the shape of it. You can't see at a glance which command feeds which read model, or which aggregate has grown three times as large as its neighbors. A format that is perfect for machines and reviews is not automatically good at the one thing a model exists for, which is talking about it with other people.
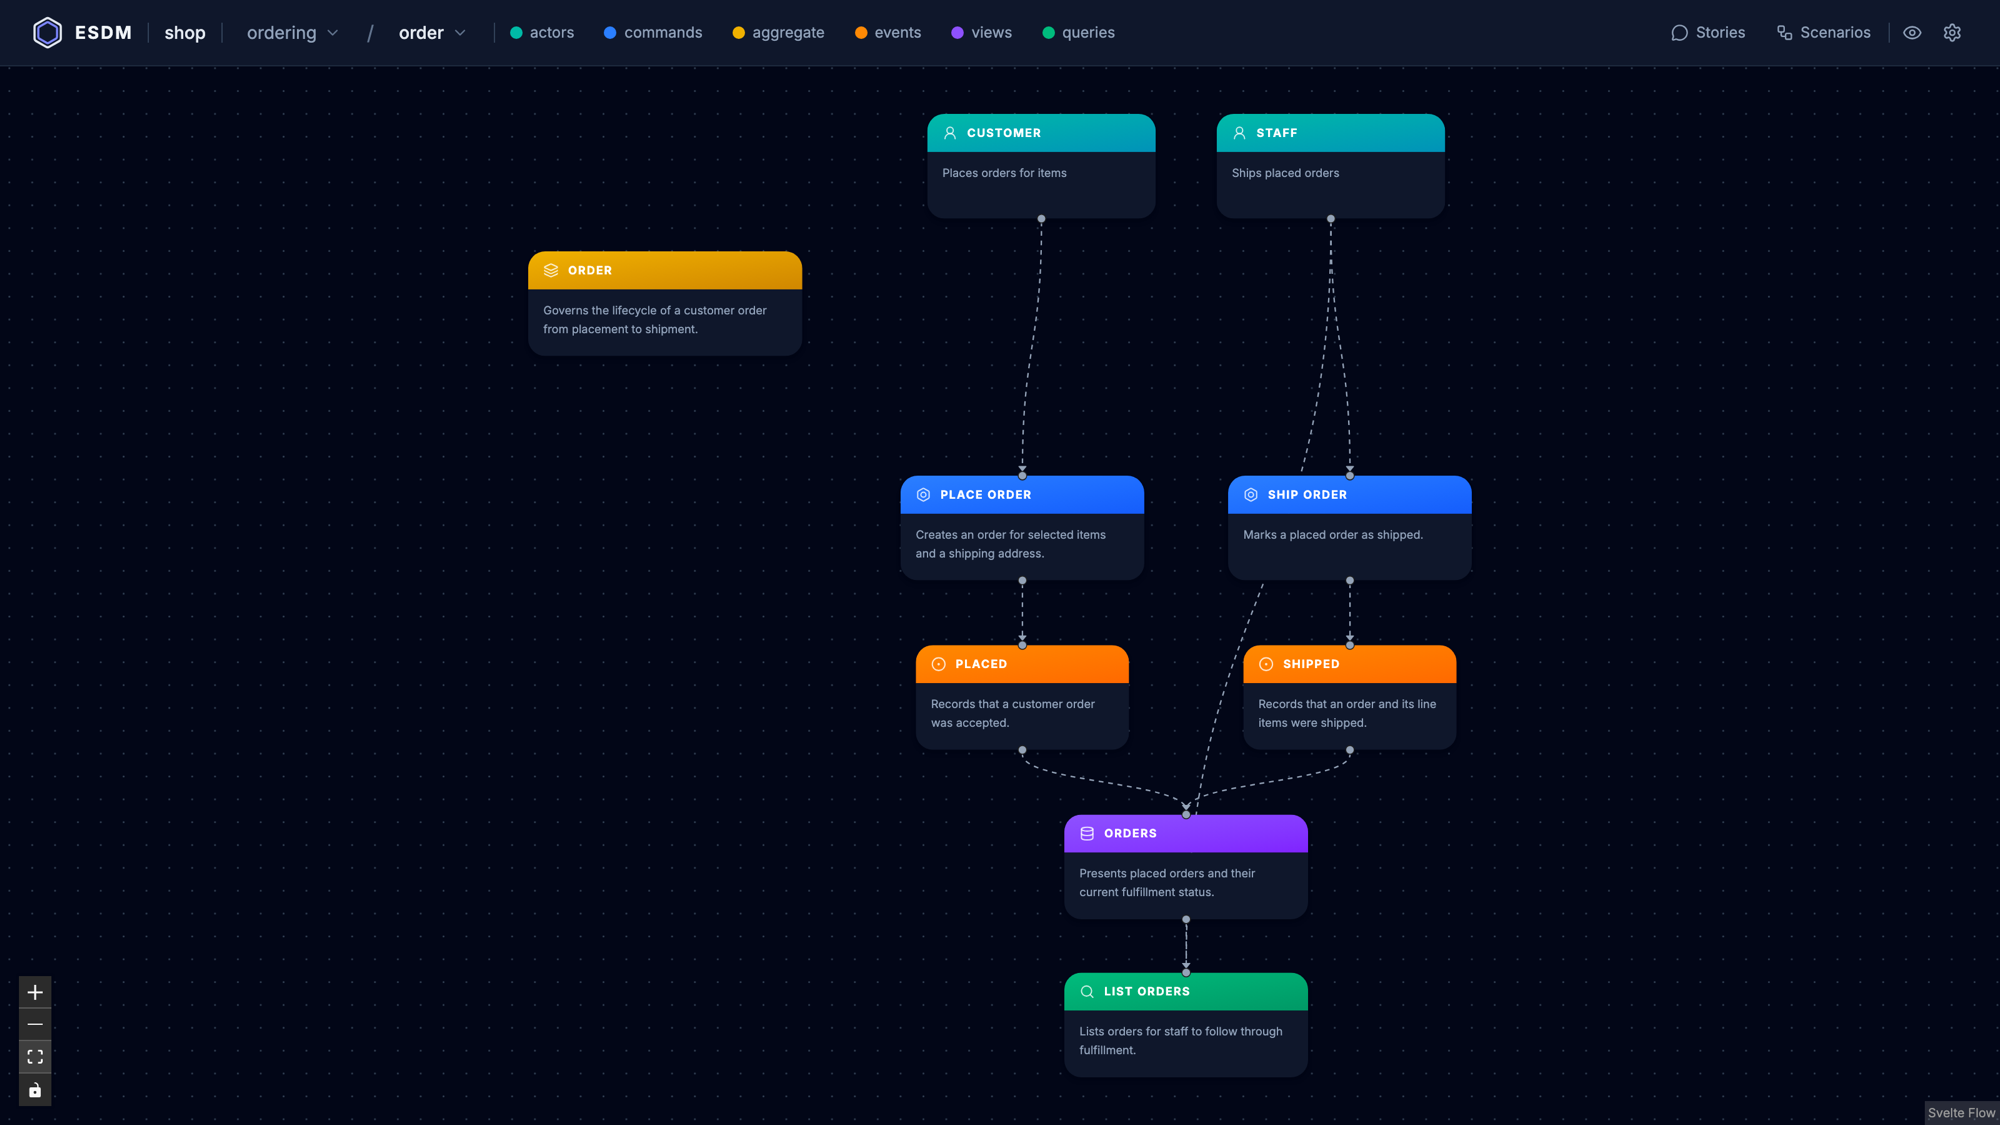
That is the gap the visualizer closes. Point it at a directory, and it walks that directory recursively, picks up every file ending in .esdm.yaml, and renders all of them together as a single graph. Actors, commands, events, aggregates, read models, and queries each get their own kind of node, with their own shape and color.
The edges are the interesting part, because the visualizer doesn't invent a single one of them. An arrow from an actor to a command appears because the command lists that actor. An arrow from a command to an event appears because the command declares that it publishes it. Events point at the read models whose projections consume them, and read models point at the queries that read from them. The board doesn't write the relation next to the line – it doesn't have to, because the kinds of the two nodes it connects already say which one it is.
Which also means the board is honest about your model in a way a drawing never is. If a command claims to publish an event that doesn't exist in that bounded context, no arrow shows up. Nothing is drawn from memory, nothing is drawn from intention. What you see is what your files actually say.
One Minute to Your First Board
There is no build step, no account, and no configuration file. There is one command:
Run that from the directory that holds your model files, then open http://localhost:3000. The image is around 44 MB, so the first pull is over before you have finished reading this paragraph. That is the whole setup: the current directory is mounted, every .esdm.yaml below it is picked up, and nothing is written back. If you would rather hack on the visualizer itself, it is a SvelteKit application built with Bun, and the repository tells you the rest.
The repository ships two example models, so you have something to look at before you have written a line of YAML yourself. Clone it, run the command from examples/shop, and you get the model the screenshot above shows: a shop domain with two bounded contexts, catalog and ordering, a customer and a staff member as actors, orders that get placed and shipped, stock that gets restocked and decreased, and read models with the queries that serve them. The other example is a small library. It is small enough to hold in your head and large enough to have the problems real models have, which makes it a good place to click around for five minutes.
ESDM models are plain files against a public schema, which means any tool can read them without asking anyone for permission, so going from a folder of YAML to a shared board really is one docker run away. If you don't have an ESDM model to point it at yet, the fastest way in is the documentation at esdm.io: write a first model, then let the visualizer show you what you just described.
Narrowing the View
Any model worth having is too big for one screen, and a graph that shows everything at once shows nothing at all. The visualizer takes that seriously and narrows the board in three steps.
The first is a dropdown for the bounded context. Pick one, and everything outside it disappears, which is the coarse cut that turns a whole domain into one team's territory. The second is a dropdown for the aggregate inside that context, and this is the cut that matters most. Choose an aggregate, and the board reduces to its slice of the world: the commands that act on it, the events they publish, the read models fed by those events, the queries that read from them, and only those actors who actually touch any of it. Everything belonging to a neighboring aggregate is gone, even though it lives in the same context.
The third step is the visibility panel, which lists the commands of the selected aggregate as a row of checkboxes, with "All" and "None" to sweep them in one go. Uncheck a command and it leaves the board – and the events it publishes leave with it, unless another visible command publishes them too. On an aggregate with a dozen commands, that is the difference between a wall of boxes and the three commands you actually came to discuss, which is precisely the move you want in an Event Storming session where the conversation keeps narrowing.
Both dropdown selections live in the URL, which quietly makes every one of those views a link you can paste into a chat. Beyond that, there is a legend that names the node kinds, a dark mode, and an option to animate the edges, which is more useful than it sounds when you are explaining the direction of a flow to someone over a screen share.
What Sits Behind a Node
Click a node, and a side panel opens with the actual content of that document. This is where the visualizer stops being a diagram tool.
For a command or an event, you get every field with its type, its description, and whether it is required. For an aggregate, you get its state and, more importantly, its invariants – the rules that must hold, written out. For a command, you get its constraints in plain language and the list of actors allowed to issue it. Actors themselves tell you whether they are human or a system, what they are responsible for, and which external system backs them. Read models report how many projections feed them, and queries show both their parameters and the shape of their result.
Take the order aggregate from the shop example. The panel shows its state – line items, a shipping address, and a status that is either placed or shipped – and next to it the invariant the model calls ships-at-most-once, spelled out as the sentence that an order transitions from placed to shipped at most once, and that shipping it again has no effect. Click the place-order command sitting next to it, and you see the shape of the data it carries, that only a customer may issue it, and that it publishes placed. Three clicks, and you know not just what the system does, but what it refuses to do.
So the board isn't a picture of the model. It is the model, arranged so that you can look at it. Zoom out and it is a map. Click once and it is the specification. There is no second artifact that needs to be kept in sync, because there is no second artifact – which is exactly the problem that a model living in a drawing tool never manages to solve.
Domain Stories and Given-When-Then
ESDM is more than structure, and the visualizer follows it there too.
It reads Domain Storytelling documents, which describe a process as numbered sentences: this actor does this to that work object, and here is what happens next. The visualizer surfaces them with their actors, their work objects, and their annotations, along with the metadata ESDM records about each story – whether it describes the world as it is or as it should be, whether it is coarse- or fine-grained, and whether it captures the pure domain or the digitalized version of it. That last distinction is the one people forget, and it is the difference between modeling a business and modeling last year's software.
It also reads Given-When-Then features. Each scenario starts from a set of events that already happened, applies a single trigger – a command, an incoming event, a query, or a timer – and states what must follow. And what follows is either a list of events, or a rejection that names the exact invariant that was violated. A scenario like that isn't documentation about the system, it is a statement about the system that can be checked.
The shop example carries a feature named order-lifecycle that shows what this feels like in practice. One scenario starts from nothing at all, has a customer issue place-order, and expects a single placed event with exactly the line items and the address that went in. The next one starts from that placed event as its given, has a staff member issue ship-order, and takes the story one step further. The aggregate's invariant said shipping happens at most once; the scenarios are where that claim stops being prose and turns into something with concrete data attached.
Seeing those scenarios next to the graph they belong to closes a loop we spent our last interview talking about: the model describes the structure, the scenarios pin down the behavior, and both live in the same files, in the same repository, under the same review process as the code they describe.
Who Built This
Impierce Technologies builds infrastructure for digital identity – EUDI wallets, verifiable credentials, and the plumbing that makes them work across organizations. It is a domain where the question of who did what, when, and on whose authority is not a reporting requirement bolted on at the end, but the actual subject matter. It is also, unsurprisingly, a domain they model carefully.
They are no strangers to Event Sourcing either: they maintain eventsourcingdb-es, an EventSourcingDB-backed implementation of the cqrs-es event store for Rust, in the open and under Apache-2.0. The visualizer carries the same license, which means you can fork it, extend it, and run it inside your own organization without asking anybody, including us.
We asked Daniel Mader, CTO of Impierce Technologies, what made them build it:
"We appreciate the deterministic nature and strict guarantees of ESDM for our modeling process. We built a thin UI visualization to bridge the gap during business sessions, purposefully keeping it read-only so that ESDM still remains the single source of truth for our YAML files."
The Loop We're Not In
When we opened ESDM up, we wrote that a generator, a validator, an editor integration, or an AI-assisted modeler could read and write the format without us being involved. The ESDM Visualizer is the first tool built on ESDM by someone other than us, and it is the proof that the sentence was more than a nice thing to say. We didn't commission it, we didn't review it, and we didn't approve it. We found out about it the way you just did.
It is worth saying plainly that this is a young project, sitting at version 0.0.1 and moving quickly. The board currently draws six kinds of node, so the policies that wire two bounded contexts together are in the model but not yet on the screen. It will grow, it will change, and it will have rough edges along the way. That is what a healthy ecosystem looks like at the beginning – not a finished product handed down from a vendor, but somebody solving their own problem well enough that it is worth sharing.
Every tool that speaks the same language is one less island in a field that has far too many of them. The visualizer is a bridge, and we didn't have to build it. That is by far the best part.
So: what are you building on ESDM? If you have written a generator, wired the models into your CI, taught an agent to read them, or built something we haven't thought of yet, we would genuinely love to know. Write to us at hello@thenativeweb.io – not because we need to be in the loop, but because we would like to watch.